Move and resize line shapes #2594
Conversation
- Reason: until now line shapes were treated the same as
  rectangles and circles with the result that a line's
  start or end point couldn't be dragged freely but only
  in the quadrant where it was located.
- Use of invisible helper elements to make grabbing a
  line and its ends easier.
- Adapt shapes's Jasmine tests and add new ones.
- Add an (editable) image test serving as an interactive
  testbed.
- Reason: to better fit the de-facto naming convention for image tests
  which is starting with the plot type.
|
Sweet! I haven't looked at the code yet, just playing with your awesome
|
|
Good call renaming 'fixed_size_shapes' to 'shapes_fixed_size' - I hadn't noticed that but yes, it's nice to keep all the shapes mocks together in our various listings. |
| xa = Axes.getFromId(gd, shapeOptions.xref); | ||
| ya = Axes.getFromId(gd, shapeOptions.yref); | ||
| function createLineDragHandles() { | ||
| var minSensoryWidth = 10, |
There was a problem hiding this comment.
Might want to move this into https://github.com/plotly/plotly.js/blob/master/src/constants/interactions.js?
This behavior for annotations is even more ugly and hard-coded
plotly.js/src/components/annotations/draw.js
Lines 536 to 540 in 2b1713d
It wouldn't need to be changed now, but if we were to move this to a constants file and reuse it in annotations, I like the
Math.max logic you have here better than the width + 6 currently in annotations (though the little-bit-extra around the head should be preserved).
|
Oh hmm, re: the y-autorange issue: I think I just got the anchor point outside the actual range of the line, so it was autoranging to the anchor point, which is totally reasonable! I'm not really sure how to handle this, but as it is it's too easy to get into strange unintuitive situations, since there's nothing to show you visually where the anchor point is. The easy way to handle this would be just not to allow GUI resizing of pixel-sized shapes, only moving them. Or perhaps allow resizing but not past the anchor point, so the shape always contains the anchor? That would cause problems for lines though, as you'd have the same problem this PR is intended to fix, of not being able to change the direction the way you want to. A more complete solution might be to show the anchor point during the resize - that would let people see what they're really doing. Perhaps a crosshair, white with a black outline like we make for zoom box corners? |
That one has its own issue already -> #679 |
|
Re: cursors for annotations
Done.
What about the |
|
Re: auto-range, anchor points and fixed size shapes, in my opinion showing the anchor point (and perhaps a thin line connecting the shape with the anchor point) would be the way to go. |
Currently the two behave the same when you click or drag them, I think - so I'd keep the cursor the same for both elements. Maybe |
- Reason: in conjunction with moving shapes [2038], to get a more
  consistent cursor behavior for movable elements.

Use 'move' cursor for movable annotation arrows

- Reason: in conjunction with moving shapes [2038], to get a more
  consistent cursor behavior for movable elements.
- Hint: only deactivate for auto-ranged axes.
- Reason: to allow for more accuracy when dragging shapes outside
  of the plot's bounds.
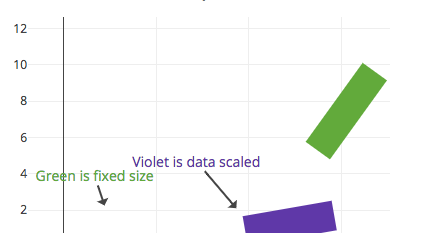
- Reason: resizing a pixel sized shape is changing the distance to its
  anchor point. The anchor point not being visible caused
  misleading perceptions in case of auto-ranged axis because the
  auto-range algorithm takes both anchor point and pixel coordinates of
  shape into account.
- Even works for `path` shapes and shapes where only one dimension
  is pixel sized.
- Reason: resize cursors were shown although resizing path shapes
  is not yet supported.
- Reason: have forgotten to update the baseline image after correcting
  a typo in an annotation.
|
Short comment on showing the anchor point: dropped the idea to additionally display a thin line. IMO showing the cross-hair is enough of a visual cue. Felt quite natural to me, please use https://github.com/plotly/plotly.js/blob/move-and-resize-line-shapes/test/image/mocks/shapes_fixed_size.json to see how it behaves in different edge cases. Also, in case there's a place in the code to gather functions together that generate some kind of "symbol" like the cross-hair shape, please let me know. Then I'd move the cross-hair generating code to this place. |
Agreed, this feels very clear to me as you have it now, makes it really obvious what's going on and how to get the alignment you want. Nice! Thanks for adding the annotation cursors as well, make sure you close #679 in addition to #2038 when this is merged 🎉 I haven't looked at the code yet, but two comments on the mechanics:
only a little blurry: very blurry:
No, not at present. We do have nearly a identical path defined in ternary. That one is smaller than the one you made, which probably makes sense, so I'm not sure DRYing this up is a good goal, though there would be something to be said for collecting these paths at least to ensure the differences between them are intentional. Anyway I wouldn't worry about that in this PR but it's a good point to keep in mind for later. |


src/components/shapes/draw.js
Outdated
| function setClipPath(shapePath, gd, shapeOptions) { | ||
| // note that for layer="below" the clipAxes can be different from the | ||
| // subplot we're drawing this in. This could cause problems if the shape | ||
| // spans two subplots. See https://github.com/plotly/plotly.js/issues/1452 |
There was a problem hiding this comment.
That issue is closed - is there still a case where this currently breaks? I see #1452 (comment) about layering and inset plots, is that what you're referring to?
There was a problem hiding this comment.
Oh sorry, you just copied this comment on refactor. NVM!
src/components/shapes/draw.js
Outdated
| @@ -232,7 +233,7 @@ function setupDragElement(gd, shapePath, shapeOptions, index, shapeLayer) { | |||
| h = dragBBox.bottom - dragBBox.top, | |||
| x = evt.clientX - dragBBox.left, | |||
| y = evt.clientY - dragBBox.top, | |||
| cursor = (w > MINWIDTH && h > MINHEIGHT && !evt.shiftKey) ? | |||
| cursor = (!isPath && w > MINWIDTH && h > MINHEIGHT && !evt.shiftKey) ? | |||
There was a problem hiding this comment.
nice catch - and thanks for updating the comment below!
Me neither 😄. I was thinking about that case. My second option would have been a bar with the full length of the not-pixel-sized dimension of the shape. But then came to the conclusion that this would probably confuse people. My rationale for the current solution is that (i) positioning the anchor cross on the x0 / y0 coordinate of the not-pixel-sized dimension gives the user a useful hint where the shape "starts" and (ii) drawing a cross even in this case is a more consistent user experience. Guess, it's best to test it out. |
- When moving a shape that is pixel-sized in one dimension and
  data-sized or paper-sized in the other dimension a centered vertical
  or horizontal bar is rendered instead of the anchor cross.
- Thereby fix a bug in `extractPathCoords` to return numerical values
  instead of numbers represented as strings.
- Also introduce the statistical `midRange` function in lib.
|
Nicely done. I like it with the small centered bars for the one-axis-fixed-pixels case. Now that they're centered, rather than sitting on one (seemingly arbitrary) edge, I could see going back to a cross, but to my eye anyway it's a little bit clearer and more intuitive as a bar. The drawing is very crisp now too, thanks for cleaning that up. I think we're ready! 💃 |
This implements a more intuitive movement and resizing of line shapes specified in #2038. Please refer to the commit message for a rough overview of the feature.
In addition renamed image test 'fixed_size_shapes' to 'shapes_fixed_size' to better fit the de-factor naming convention for image tests.