-
-
Notifications
You must be signed in to change notification settings - Fork 1.9k
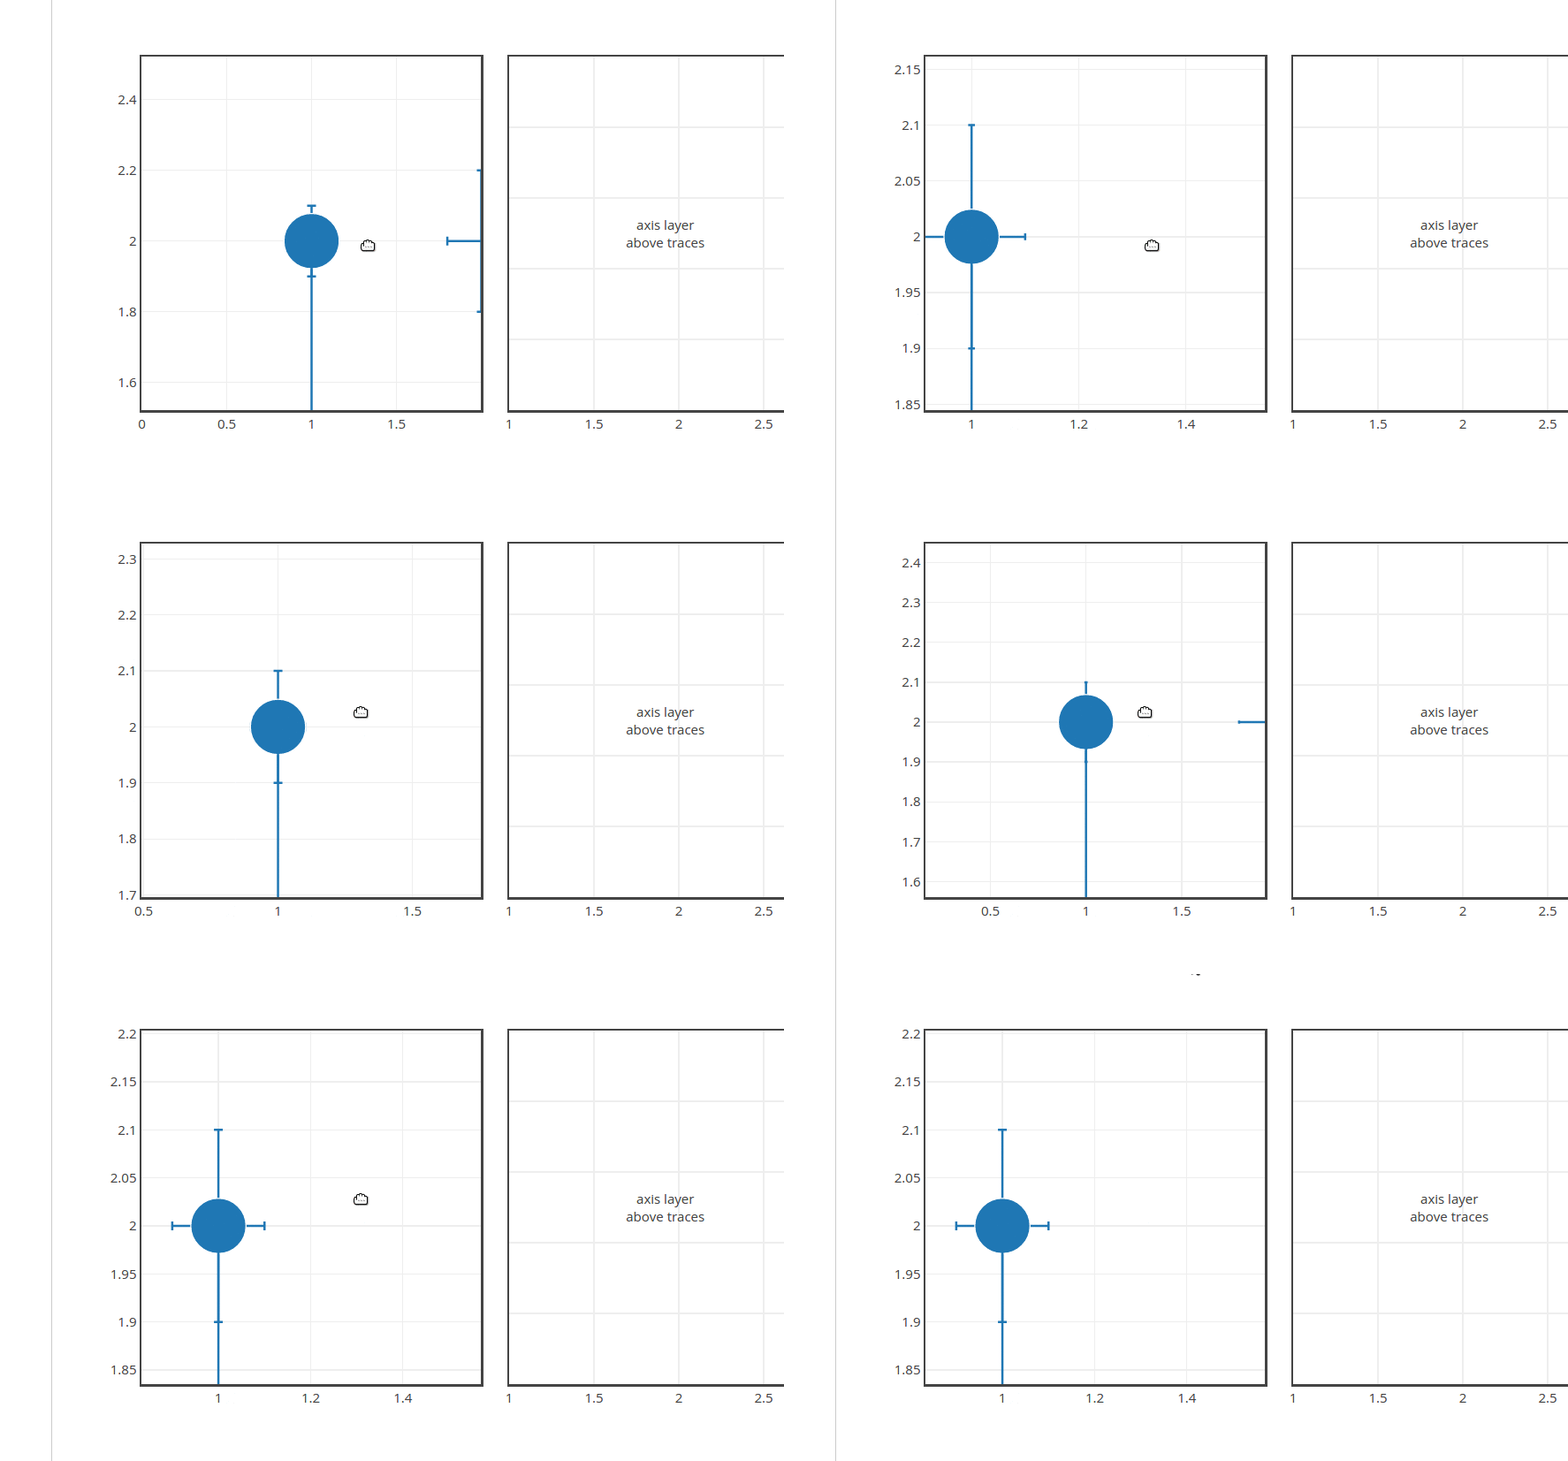
better zooming behavior for errorbars, bars, and box plots #1897
New issue
Have a question about this project? Sign up for a free GitHub account to open an issue and contact its maintainers and the community.
By clicking “Sign up for GitHub”, you agree to our terms of service and privacy statement. We’ll occasionally send you account related emails.
Already on GitHub? Sign in to your account
Conversation
| @@ -117,6 +118,7 @@ module.exports = function plot(traces, plotinfo, transitionOpts) { | |||
|
|
|||
| if(isNew) { | |||
| xerror = errorbar.append('path') | |||
| .style('vector-effect', 'non-scaling-stroke') | |||
There was a problem hiding this comment.
Choose a reason for hiding this comment
The reason will be displayed to describe this comment to others. Learn more.
There was a problem hiding this comment.
Choose a reason for hiding this comment
The reason will be displayed to describe this comment to others. Learn more.
right - because that's about the length of the whisker, not its stroke. I couldn't think of a way to handle this at first but now that you mention it, I suppose we could have the x scale of the y errorbars (and the y scale of x error bars) get inverse-scaled the same way as we do for both x and y scales of the points... I can look into this but it may take a little more work, do you think it's worth holding up this PR or shall I tackle it separately later?
There was a problem hiding this comment.
Choose a reason for hiding this comment
The reason will be displayed to describe this comment to others. Learn more.
right - because that's about the length of the whisker, not its stroke
Thanks for clarification 📚
do you think it's worth holding up this PR or shall I tackle it separately later?
Not worth holding up this PR. 👍
Opening a new issue will be just fine.
| @@ -747,7 +747,7 @@ module.exports = function dragBox(gd, plotinfo, x, y, w, h, ns, ew) { | |||
| .call(Drawing.setTranslate, clipDx, clipDy) | |||
| .call(Drawing.setScale, xScaleFactor2, yScaleFactor2); | |||
|
|
|||
| var scatterPoints = subplot.plot.select('.scatterlayer').selectAll('.points'); | |||
| var scatterPoints = subplot.plot.selectAll('.scatterlayer .points, .boxlayer .points'); | |||
There was a problem hiding this comment.
Choose a reason for hiding this comment
The reason will be displayed to describe this comment to others. Learn more.
Nice touch 👌
I can't think of one either. I'm ok leaving this thing untested. |
We could consider it. The space available for the labels will not scale back though, so when you zoom out the labels will start to overlap the lines, and when you zoom in they'll get disconnected. |
| @@ -124,8 +124,10 @@ module.exports = function plot(gd, plotinfo, cdbar) { | |||
| // append bar path and text | |||
| var bar = d3.select(this); | |||
|
|
|||
| bar.append('path').attr('d', | |||
| 'M' + x0 + ',' + y0 + 'V' + y1 + 'H' + x1 + 'V' + y0 + 'Z'); | |||
| bar.append('path') | |||
There was a problem hiding this comment.
Choose a reason for hiding this comment
The reason will be displayed to describe this comment to others. Learn more.
Non- ⛔ comment
What about bar text labels?
they probably would benefit from the same tricks scatter text nodes get on scroll
There was a problem hiding this comment.
Choose a reason for hiding this comment
The reason will be displayed to describe this comment to others. Learn more.
These are also tricky - as sometimes they will scale up, sometimes they won't, and sometimes they'll move or rotate after the zoom. Also I played around with including them and the element structure isn't quite set up the same way as scatter text points so it's nontrivial to make it work. I'll add this to the list of possible future improvements.
|
open items collected in #1899 |
|
Solid improvements 💃 |


fixes #1879 and a few related effects:
As far as I can tell that's everything we put on SVG cartesian axes.
Not sure if there's a useful way to test this - I was pondering making a complicated plot and testing that every
<path>on it either hasvector-effect: non-scaling-strokeset or matches.scatterlayer .points .pointor.boxlayer .points .pointbut I kind of feel like that will cause more problems than it solves, and now that we know about these strategies we won't forget to use them when we make new trace types.cc @etpinard