Open
Description
Recently I started working with the new shapviz package. In particular, the waterfall plot was working just fine for what I needed to visualise. Unfortunately, I was unable to use ggplotly to render the plots in plotly.

As it turns out, the waterfall plot is different from plotly's waterfall chart as it is built on the GeomGeneArrow geom from
from https://github.com/wilkox/gggenes.
Warning message in geom2trace.default(dots[[1L]][[1L]], dots[[2L]][[1L]], dots[[3L]][[1L]]):
“geom_GeomGeneArrow() has yet to be implemented in plotly.
  If you'd like to see this geom implemented,
  Please open an issue with your example code at
  [https://github.com/ropensci/plotly/issues](https://github.com/ropensci/plotly/issues)
In addition, geom_GeomFitText, which is needed for rendering text over plot elements is also unimplemented.
geom_GeomFitText() has yet to be implemented in plotly.
  If you'd like to see this geom implemented,
  Please open an issue with your example code at
  [https://github.com/ropensci/plotly/issues](https://github.com/ropensci/plotly/issues)
Reprex adapted from the default shapviz example below:
#library imports
install.packages("shapviz")
library(shapviz)
library(ggplot2)
library(xgboost)
set.seed(3653)
X <- diamonds[c("carat", "cut", "color", "clarity")]
dtrain <- xgb.DMatrix(data.matrix(X), label = diamonds$price)
fit <- xgb.train(
params = list(learning_rate = 0.1, objective = "reg:squarederror"),
data = dtrain,
nrounds = 65L
)
X_small <- X[sample(nrow(X), 2000L), ]
shp <- shapviz(fit, X_pred = data.matrix(X_small), X = X_small)
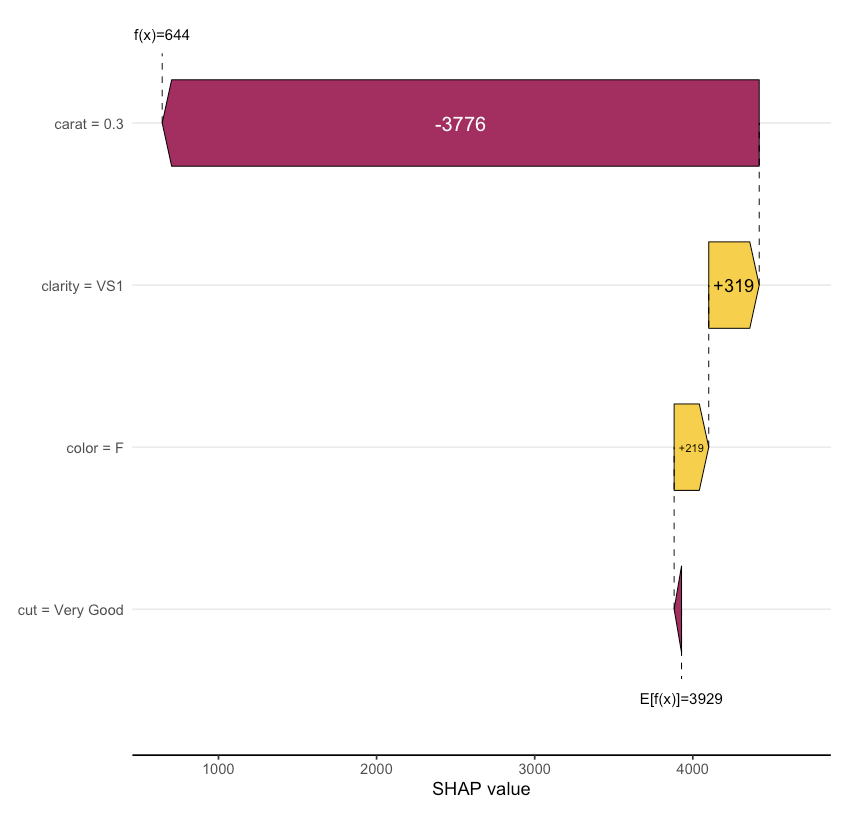
waterfall_plot <- sv_waterfall(shp, row_id = 1)
library(plotly)
ggplotly(waterfall_plot)Expected Output should render similar to this (original ggplot):
Metadata
Metadata
Assignees
Labels
No labels